Once you have java option option -XX:+HeapDumpOnOutOfMemoryError, heap dump will be generated once JVM is out of memory.
or else you can use JMX tools to generate heap dump.
for more information go through http://atgkid.blogspot.com/2011/12/how-to-take-thread-dumps-and-heap-dumps.html
Once heap dump is generated.
Download Eclipse Memory Analyzer (For 64-bit OS get 64 bit version) - http://eclipse.org/mat/
Depending on the heap size dump you need to increase the vm size of Eclipse MAT
To increase size in Mac OS X, Right click on MemoryAnalyzer (application) then "Show Package Contents".
Edit - MemoryAnalyzer.app/Contents/MacOS/MemoryAnalyzer.ini
In below example - size of heap dump is 1.8 GB and Eclipse MAT vm size is "3048m" and instance vm size (from which the heap dump is generated) is 2560m.
Open heap dump -

Once the heap dump is loaded in Eclipse Memory Analyzer
Open dominator tree.

Select "Group by class"

By here you can know what type of objects occupied much of heap dump.
For example - In below scenario, GSAItem objects occupy 41% of heap dump (788 MB of 1.8 GB)

To further know which item's are resposible for 41%
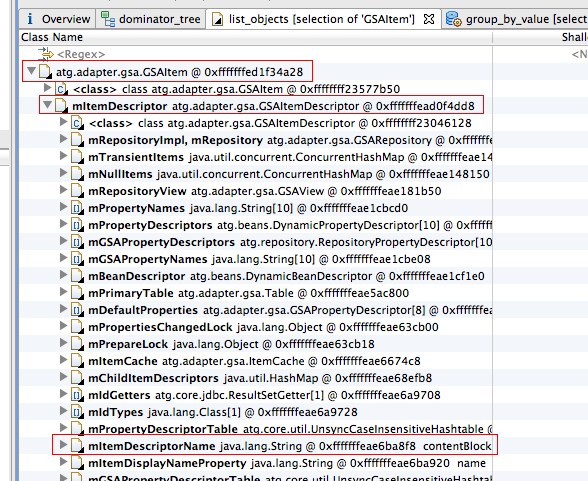
Right click on atg.adapter.gsa.GSAItem -> List objects -> with outgoing references

Once the objects are listed. To know what type of items.
In GSAItem object, mItemDescriptor.mItemDescriptorName will give the name of the GSAItem.
We need to group by value "mItemDescriptor.mItemDescriptorName" on Class atg.adapter.gsa.GSAItem (in dominator_tree).
So go back to dominator_tree tab, right click on atg.adapter.gsa.GSAItem -> Java Basics -> Group By Value.

In Group By Value window, fill field with "mItemDescriptor.mItemDescriptorName" and click finish.

This will take time depending on the number of objects it needs to parse.
Once it is done, you can see which type of items (GSAItems) take more space in jvm heap space. (sort it by Retained Heap)
In below scenario, ss-sku items took 333 MB of jvm heap space and number of ss-sku items in memory are 35,465 (i.e 35,465 items are cached in memory)

Hope this helps!
Very nice article. Thank you.
ReplyDeleteI came across a tool named HeapHero(HPROF is a simple command line tool that captures CPU/Heap profiles to identify performance bottlenecks in applications. By default, this tool writes the captured profiles to a file with '.hprof ' extension. HPROF file may contain CPU usage, heap allocation statistics, heap dump, thread stack traces and monitor states. It can be either in binary or text format. Heap Hero is a powerful tool to view and analyze HPROF files) in analysing heap dumps; I hope this may help you, folks, too.
ReplyDelete