Thursday, December 29, 2011

Heap dump analysis

Below is one example of analyzing heap dump to know which objects are responsible for JVM out of memory.
Once you have java option option -XX:+HeapDumpOnOutOfMemoryError, heap dump will be generated once JVM is out of memory.
or else you can use JMX tools to generate heap dump.
for more information go through http://atgkid.blogspot.com/2011/12/how-to-take-thread-dumps-and-heap-dumps.html

Once heap dump is generated.

Download Eclipse Memory Analyzer (For 64-bit OS get 64 bit version) - http://eclipse.org/mat/
Depending on the heap size dump you need to increase the vm size of Eclipse MAT
To increase size in Mac OS X, Right click on MemoryAnalyzer (application) then "Show Package Contents".
Edit - MemoryAnalyzer.app/Contents/MacOS/MemoryAnalyzer.ini

In below example - size of heap dump is 1.8 GB and Eclipse MAT vm size is "3048m" and instance  vm size (from which the heap dump is generated) is 2560m.

Open heap dump -


Once the heap dump is loaded in Eclipse Memory Analyzer
Open dominator tree.

Select "Group by class"

By here you can know what type of objects occupied much of heap dump.
For example - In below scenario, GSAItem objects occupy 41% of heap dump (788 MB of 1.8 GB)

To further know which item's are resposible for 41%
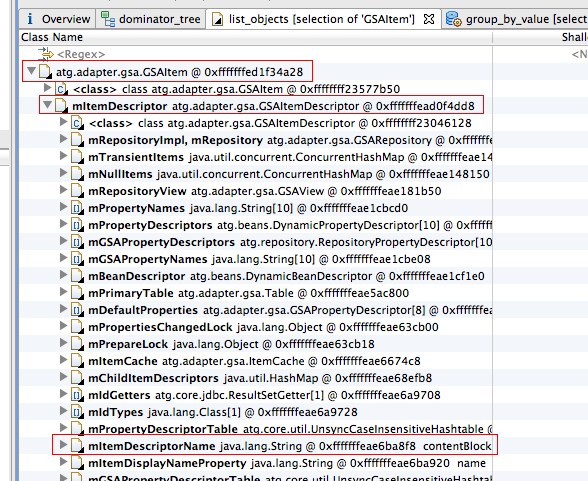
Right click on atg.adapter.gsa.GSAItem -> List objects -> with outgoing references

Once the objects are listed. To know what type of items. 
In GSAItem object, mItemDescriptor.mItemDescriptorName will give the name of the GSAItem.

We need to group by value "mItemDescriptor.mItemDescriptorName" on Class atg.adapter.gsa.GSAItem (in dominator_tree).
So go back to dominator_tree tab, right click on atg.adapter.gsa.GSAItem -> Java Basics -> Group By Value.


In Group By Value window, fill field with "mItemDescriptor.mItemDescriptorName" and click finish.

This will take time depending on the number of objects it needs to parse. 
Once it is done, you can see which type of items (GSAItems) take more space in jvm heap space. (sort it by Retained Heap)
In below scenario, ss-sku items took 333 MB of jvm heap space and number of ss-sku items in memory are 35,465 (i.e 35,465 items are cached in memory)


Hope this helps!


How to take thread dumps and heap dumps using java tools

1) To take thread dumps -
Once you have below java options
-Xdebug -Xrunjdwp:transport=dt_socket,server=y,suspend=n,address=8000
(Note: all tools mentioned below are available in <JAVA_HOME>/bin)

Using jdb
jdb -connect com.sun.jdi.SocketAttach:hostname=localhost,port=8000

> suspend
All threads suspended.
"where all" will give snapshot of all threads.
> where all
http-127.0.0.1-8443-6:
  [1] java.lang.Object.wait (native method)
  [2] java.lang.Object.wait (Object.java:485)
  [3] org.apache.tomcat.util.net.JIoEndpoint$Worker.await (JIoEndpoint.java:416)
  [4] org.apache.tomcat.util.net.JIoEndpoint$Worker.run (JIoEndpoint.java:442)
  [5] java.lang.Thread.run (Thread.java:662)
http-127.0.0.1-8443-5:
  [1] java.lang.Object.wait (native method)
  [2] java.lang.Object.wait (Object.java:485)
  [3] org.apache.tomcat.util.net.JIoEndpoint$Worker.await (JIoEndpoint.java:416)
  [4] org.apache.tomcat.util.net.JIoEndpoint$Worker.run (JIoEndpoint.java:442)
  [5] java.lang.Thread.run (Thread.java:662)
http-127.0.0.1-8443-4:
  [1] java.lang.Object.wait (native method)
  [2] java.lang.Object.wait (Object.java:485)
...
..
to resume all threads.
> resume

Using  jstack -
jstack <jvmid>  (you can get jvmid using jps)

For example -
C:\Documents and Settings\Administrator>jps
4416 Main
5800
3300 Jps
6676

C:\Documents and Settings\Administrator>jstack 4416
2011-12-27 16:32:19
Full thread dump Java HotSpot(TM) Server VM (19.0-b09 mixed mode):

"ajp-127.0.0.1-8009-Acceptor-0" daemon prio=6 tid=0x6fc39c00 nid=0x11fc runnable [0x6d27f000]
   java.lang.Thread.State: RUNNABLE
        at java.net.PlainSocketImpl.socketAccept(Native Method)
        at java.net.PlainSocketImpl.accept(PlainSocketImpl.java:390)
        - locked <0x14495ae0> (a java.net.SocksSocketImpl)

To get thread dump using jboss jmx-console, please go through below link
http://atgkid.blogspot.com/2011/10/how-to-take-thread-dumps-in-jboss.html

2) To take heap dumps - 
Using jmap (available from jdk 1.6 but can also be used on jvm with 1.4+ )
jmap -dump:format=b,file=<filename>.hprof <jvmid>

C:\Documents and Settings\Administrator>jps
4416 Main
5800
3300 Jps
6676

C:\Documents and Settings\Administrator>jmap -dump:format=b,file=sample.hprof 4416
Dumping heap to C:\Documents and Settings\Administrator\sample.hprof ...
Heap dump file created

Using java option -XX:+HeapDumpOnOutOfMemoryError
Once you have above java option, JVM will create heap dump once it is out of memory.

Using  jconsole - Java Monitoring and Management Console - JMX-compliant graphical tool for monitoring a Java virtual machine. It can monitor both local and remote JVMs
To use jconsole you need to have java option "-Dcom.sun.management.jmxremote"


heap dump file will be created in folder from where the application is run. For example - <JBOSS-HOME>/bin or <BEA-DOMAIN-HOME>/bin

Using  jvisualvm - comes with java 1.6 but can be used to visualize/monitor applications running on jdk 1.4 and higher. 
Monitor showing CPU and Heap Usage and total threads and classes. 
To get thread dump you can use

Sample heap dump taken using jvisualvm


To take thread dumps in jvisualvm


Sample Thread dump taken using jvisualvm 


Saturday, December 10, 2011

hitCount for referred items will not be increased while accessing parent item

While accessing an item, hitCount (in Dynamo component browser repository cache usage statistics) for referred items will not be increased.

For example - In PioneerCycling
In test4.jsp
<%@ taglib uri="dsp" prefix="dsp"%>
<dsp:page>
<dsp:importbean bean="/atg/commerce/catalog/ProductLookup"/>
<dsp:droplet name="ProductLookup" >
<dsp:param name="id" value="prod10023"/>
<dsp:param name="elementName" value="product"/>
<dsp:oparam name="output">
<dsp:valueof param="product.smallImage.url"/> <br>
</dsp:oparam>
</dsp:droplet>
</dsp:page>
By default PioneerCycling ProductCatalog has simple cache and item-cache-size for all items is 1000.
Before accessing this jsp

Product - accesscount is 0. Hit count is 0.
Media - accesscount is 0, hit count is 0.
Once test4.jsp is accessed for the first time.

Product - accesscount is 2, hit count is 0.
Media - accesscount is 6, hit count is 0.

First time access - In logs. select queries are fired.
[++SQLQuery++]
 SELECT t1.product_id,t1.version,t1.description,t1.nonreturnable,t1.brand,t1.end_date,t1.display_name,t1.disallow_recommend,
        t1.long_description,t1.creation_date,t1.start_date,t1.parent_cat_id,t1.product_type
   FROM dcs_product t1
  WHERE t1.product_id = ?
-- Parameters --
p[1] = {pd} prod10023 (java.lang.String)
[--SQLQuery--]
[++SQLSelect++]
 SELECT template_id,thumbnail_image_id,small_image_id,large_image_id
   FROM dcs_prd_media
  WHERE product_id=?
-- Parameters --
p[1] = {pd} prod10023 (java.lang.String)
[--SQLSelect--]

Once again if the test4.jsp is refreshed

Product - accessCount is 3, hit count is 1.
Media - accessCount is 6, hit count is 0.

As you can observe - neither the access count or hit count is increased for media items. But for product it got increased.
Note: Only first time queries are fired. Once items are cached there are no queries fired for product and media.
As test4.jsp is refreshed, product stats are getting increased but media stats are not getting increased.

Why?
Reason - (Below explanation is given by Oracle ATG support Nick Glover)
First time when product is accessed all its properties are loaded from database including media items, so for the first time accessCount for product and media items is increased. Once media items are loaded they are stored as references in the product property values. So, the next time the product is accessed, they don't need to be loaded at all, the product has a reference to them. This is not considered a cache hit on the media items because the media item cache is not being used in this situation; instead the product item cache is being used and its references to the media items are what is saving the trip to the database. And obviously, the hit ratio for media items is going to be 0% because the initial loading of them is a miss, and you have not done any direct requests for the media items that successfully found them in cache to get a cache hit.

Regarding Weak entry cache -
Suppose that number of products in application is 10000 and the item-cache-size is 5000
and number of media-items is 30000 (for each product 3 media-items) and the item-cache-size is 1000.
So if 1 product is accessed, 3 media items are loaded.

In above scenario, if 1000 products are accessed
product entry count is 1000 (in main cache)
media entry count is 1000 (in main cache)
media weak entry count is 2000 (in weak cache)

weak entry items in weak cache are not garbage collected until the referenced item (parent item) is removed/pushed from main cache.